Our “Special” K-Shaped Economy Serving the Disproportionate Difference.

Our "Special K-Shaped Economy
Serving the Disproportionate Difference.
What You Need to Know
- ◆The U.S. economy is disproportionately K shaped with 10% and 90% living two different realities.
- ◆Consumer prices, 24% higher than before the pandemic, hits households who spend the most on necessities.
- ◆The Strait of Hormuz closure triggered the largest oil supply disruption in history, accelerating the K and hitting the lower arm hardest.
- ◆The top 10% of households hold 69% of all wealth but even the upper arm has fractures.
- ◆For businesses, understanding which arm of the K your customers (and if you’re B2B, your customer’s customers) occupy is evolving insight for your growth strategy.
- ◆The K looks different around the world. Europe's safety nets compress the divide. Latin America and Sub-Saharan Africa face the steepest inequality. Asia is mixed, acutely exposed to the energy shock.
SalesGlobe Signals is about seeing a bigger, macro view on growth and taking actions that will help you reach your growth aspirations. This month we examine the K-shaped economy, a structurally disproportionate divergence now defining the consumer and business landscape, and ask: How can we best address the K shaped economy and do well while doing good?
In Signals, our focus is on helping executives answer two questions for their businesses:
- What Are the Market Signals? Indicators you might watch for your business that may signal what’s ahead.
- What Does This Mean for Profitable Revenue Growth? Based on the signals, how you may think about growth and the actions you may consider.
The U.S. economy is robust in the aggregate. Listen to the morning financial shows and engage in the sectors that are surging and it all looks great. GDP is growing. Unemployment is hovering near historic lows. The S&P has record highs 23 times in 2026. Interest rates? We’ll as I’ve detailed in prior issues, they’re also near historic lows from the near 20% rates of the 1980s and have been one of the biggest forces fueling multi-decade growth.
But despite the bullish news the economy has diverged into two groups. The top 10% are thriving on asset appreciation, wage growth, and falling AI-era costs. The other 90%, the majority, are managing, stretching, or falling behind squeezed by sticky inflation, elevated interest rates, tariff-driven price increases, and now a global energy shock from the Strait of Hormuz. The letter that describes it all is K, and in 2026, that letter is sharper than ever.
The K-shaped economy is a special disproportionate K with different market realities. It is the current market environment, and for most businesses, understanding which arm of the K your customers (and customers’ customers) are living in, and how you can better serve them, is a big consideration for your growth strategy.
What Are the Market Signals?
The K-shaped economy took hold as a concept in 2020, but in 2025 it became a business reality. The divergence between high income and moderate to lower income households is now embedded in corporate earnings calls, consumer sentiment data, retail foot traffic, and credit markets. It is structural, not cyclical, and it is being deepened by three powerful forces: sticky post-pandemic inflation, tariff-driven price increases, and now a geopolitical energy shock that is hitting the lower arm of the K hardest.
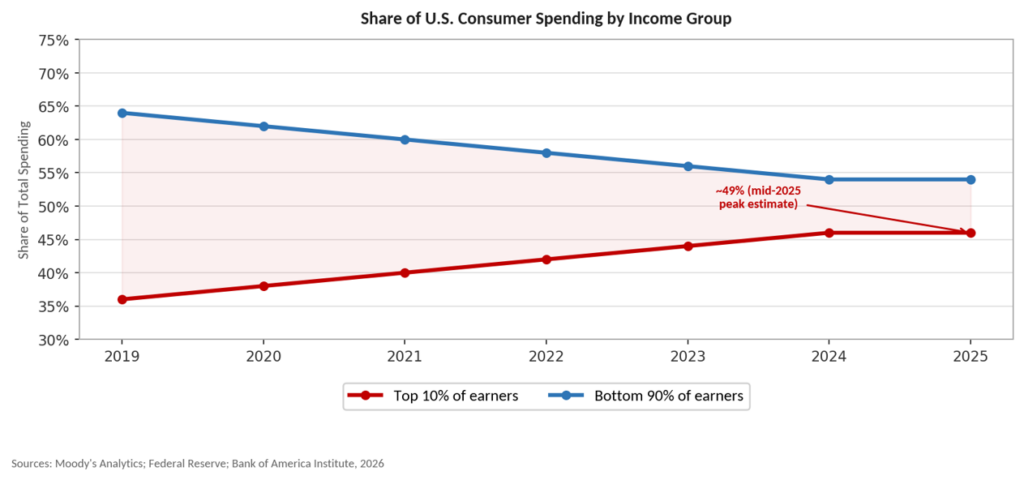
The term itself captures a simple but consequential truth: in a K-shaped economy, different groups move in opposite directions. The upper arm rises, asset values climb, wage growth accelerates for skilled workers, luxury markets boom. The lower arm falls, purchasing power erodes, debt delinquencies rise, discretionary spending contracts, and the psychological distance from financial security grows wider. Growth at the aggregate level can obscure the fact that most of the consumer market is in a fundamentally different economic reality than the top of the K. In this issue of Signals, as we look at the K, we’re using two related but distinct measures: household income and household wealth, which both tell the same story. The top 10% of earners drive nearly half of all consumer spending while the top 10% of households by net worth hold approximately 69% of all wealth.
(ADD Special K-Shaped Economy Drawing)
Signal 1. The Spending Split Is Real and Getting Wider.
Moody’s Analytics calculates that spending by the top 10% of U.S. households grew 62% between Q3 2020 and Q3 2025, far outpacing every other income group. By Q2 2025, that same top 10% was responsible for nearly half of all U.S. consumer spending, a concentration of purchasing power that Moody’s chief economist Mark Zandi described as “stunning.” The top 1% of households now hold 31.7% of all U.S. wealth, the highest share on record since the Federal Reserve began tracking household wealth in 1989, roughly equal to the combined wealth of the bottom 90%. The top 10% of households hold nearly 69% of total household wealth as of 2025.
Meanwhile, spending by the lower third of Bank of America's cardholders shrank in mid-2025 and remained nearly flat through the first quarter of 2026. The New York Fed reported that by Q4 2025, 4.8% of all outstanding household debt was in some stage of delinquency, the highest rate since 2017. Credit card balances hit a fresh all-time high of $1.28 trillion. Student loan delinquencies jumped to 9.6% of balances 90 or more days past due. Mortgage delinquencies are rising fastest in moderate to lower income areas. And the personal savings rate at 4.8% in Q3 2025, still sits well below the pre-pandemic average of 7.3%.
The split is not just income — it is psychology. The University of Michigan's consumer sentiment data shows that the confidence gap between the highest and lowest earners expanded to its widest in more than a decade in 2025. Wealthier households, buoyed by stock portfolios hitting record highs and rising home equity, felt good. Everyone else was doing the math on groceries.
What Does This Mean for Profitable Revenue Growth?
The most immediate implication is market segmentation, not as a marketing exercise, but as a strategic necessity. For companies in consumer goods, retail, hospitality, financial services, and healthcare, the question is no longer “how do we serve our customers?” It is “which customers, in which arm at which level, can we serve better?” Growth will increasingly pool at the top, unless and until structural pressures on moderate to lower income households ease. Business to consumer companies that have not explicitly mapped their customer base against the K have a dated and blurred view of their markets. And business to business companies that don’t understand how their business customers’ customers is impacted are masked from their customer’s reality.
For B2B companies, unmasking the K of their customers is clarifying. Companies serving consumer-facing industries such as retail chains, restaurant groups, consumer packaged goods, food and beverage, regional healthcare networks, and mid-market financial services need to understand that their customers’ revenue dynamics are fissured into two disproportionally different parts. A retail client with 40% of its revenue from moderate to lower income consumers is in a different strategic position than one whose base skews affluent. That context should shape everything from value proposition to account planning to pricing tactics.
For financial services and wealth management firms, the upper arm of the K is a generational opportunity. High-net-worth household wealth is growing at its fastest pace in decades. The number of ultra-high-net-worth Americans grew 5.4% in the first half of 2025 alone. Firms that can serve this segment with differentiated advice, multi-asset strategies, and sophisticated estate planning are in a market that is actively expanding. Firms that cannot are competing for a shrinking share of a more price-sensitive, more debt-burdened pool.
Signal 2. Inflation is One Force that Formed the K and It’s Not Done.
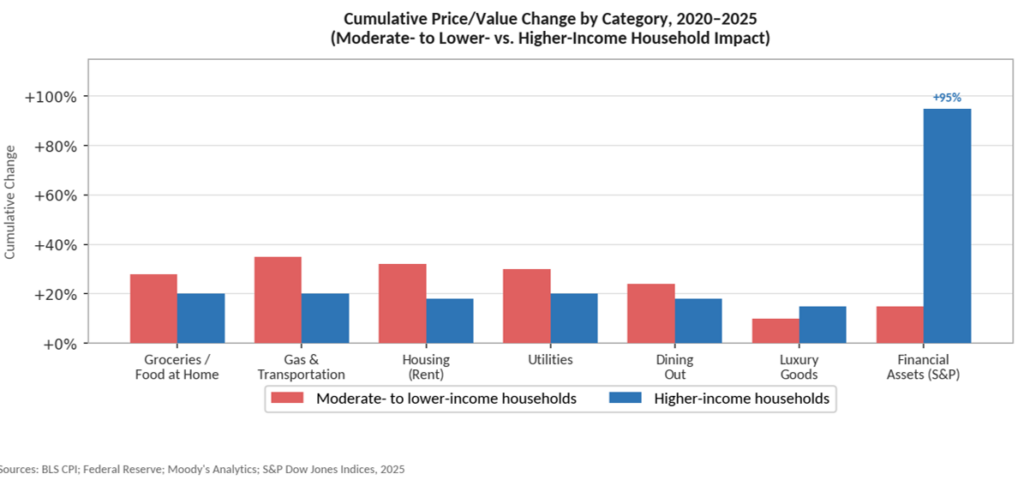
Consumer prices are 24% higher than they were before the pandemic. Your grocery bill that was $100 in 2019 is now $125 for the same things or some of the same things in downsized packages and the average inflation-adjusted income has not increased over that same period. That’s a fact that headline inflation numbers obscure. In my SalesGlobe Signals issue on Why is Inflation Such a Big Deal… I detailed this historic jump where we absorbed four years of inflation post-2020 that was nearly half the prior twenty years. When inflation “moderates” to 2.9%, it means that prices are rising more slowly not that prices have come down. The cumulative damage to purchasing power for moderate to lower income households is enormous, and it has been systematically worse for them than for higher earners.
The New York Fed's research describes it. Beginning in late 2022, moderate to lower income households have consistently faced higher inflation rates than middle and high income households. This is because they spend a disproportionate share of their income on necessities such as groceries, rent, utilities, and transportation. These are the categories where price increases have been sharpest and they’re the largest portion of this group’s budgets. The Federal Reserve's own analysis found that tariffs implemented through November 2025 raised core goods PCE prices by 3.1%, and Goldman Sachs warned that prices are “unlikely to fall meaningfully anytime soon” even after tariff adjustments. This is because, even with a change, companies are quick move prices up fast and down slow to move them down.
Wealthier households, by contrast, spend a higher share of income on services, investments, and experiences, categories where price dynamics have been more favorable and where the wealth effect of a rising stock market has more than compensated for any price pressure. The Federal Reserve’s rate cuts in late 2024 provided some relief on borrowing costs, but the Fed’s pause in early 2026 meant elevated mortgage rates and credit card APRs, averaging 21.52% in Q1 2026, remained a significant drag on moderate to lower income household finances. The anticipated lower rates, increase in housing market velocity, and ease on short term interest didn’t materialize.
What Does This Mean for Profitable Revenue Growth?
For business to consumer companies, such as grocery chains, restaurants, retailers, and consumer packaged goods brands, the inflation story is now a pricing power and volume problem. Companies that raised prices 20% to 40% during the pandemic years are discovering that moderate to lower income customers have hit a wall. McDonald’s revived value menus in late 2025 because it had to. Chipotle and Cava reported pullback from moderate to lower income younger customers, beverage companies are watching consumers trade down from premium brands. The brands winning on the lower arm of the K are those offering genuine value such as Walmart, TJX, and Aldi, not those trying to hold premium prices for a mass market that can no longer support them.
For business to business companies selling into consumer-facing industries, the tariff and inflation environment is reshaping procurement behavior. Finance teams are scrutinizing expenses more rigorously than at any point since 2009 and the procurement bull dogs are off leash. Organizations who can demonstrate clear ROI such as cost reduction, revenue protection, efficiency gain, as well as an understanding of and solutions for their customer’s challenges are winning. Those relying on relationship-driven sales without clear value and market-aware solutions are struggling.
For companies selling into the premium or high-net-worth market, the inverse is true. Luxury retail sales are expected to grow 5.5% worldwide in 2026. Experiential luxury, bespoke travel, wellness, and fine dining are growing and are projected to capture more than 35% of the global luxury market by 2030. The ulta high net worth population is growing and their spending is accelerating. The key risk is not market size. It is continued stock growth, since luxury demand is highly correlated with equity market performance.
Signal 3. The Hormuz Shock is a K-Shape Accelerant.
In March, Iran had effectively closed the Strait of Hormuz, through which approximately 20% of all global oil trade and significant LNG volumes normally flow. The International Energy Agency described it as ‘the largest supply disruption in the history of the global oil market.” Ship transits through the strait collapsed from around 130 per day in February to just 6 in March. Brent crude surged 65% to record its highest monthly rise ever, reaching above $100 per barrel before a temporary ceasefire eased prices modestly.
The global economic ripple effects are significant and uneven. The United Nations Conference on Trade and Development projects global merchandise trade growth will decelerate from 4.7% in 2025 to between 1.5% and 2.5% in 2026. Global GDP growth is expected to slow from 2.9% to 2.6%. The Peterson Institute for International Economics (a private, nonpartisan research institution in Washington) warned that inflation rising above 4% by end of 2026 is “arguably the most likely scenario.” European gas benchmarks nearly doubled as Qatari LNG was disrupted. Asia, which received 84% of Gulf crude exports before the conflict, faces acute supply challenges.
In the U.S., where it was initially disregarded as minor since most of the country’s petroleum comes from other sources, it has had a big impact. U.S. consumers, relatively insulated by domestic production, are nonetheless absorbing higher gasoline and heating costs that land heaviest on those who spend the largest share of income on transportation and energy. In the U.S. and globally, the crisis also disrupted non-energy commodities critical to everyday life: fertilizers (impacting food costs), aluminum, sulfur, plastics feedstocks, and steel. These are cost-of-living increases that moderate to lower income households bear disproportionately. Wealthy households invested in energy stocks, insulated by financial cushion, and less exposed to fuel costs as a share of spending, experience the shock very differently.

What Does This Mean for Profitable Revenue Growth?
For energy and transportation companies, the Hormuz shock has created a period of elevated revenue and margin, a positive for them, but also uncertainty. U.S. oil producers are the relative beneficiaries, and domestic LNG exporters face extraordinary demand from energy-starved European buyers who have historically relied too heavily on energy sources that have become impacted by conflict (the Middle East with the Iran conflict and Russia with the Ukraine conflict). The risk for energy producers who are now benefitting is a rapid normalization of supply once the conflict resolves, reducing price and revenue. With recent starts and stops of an Iran deal and the Memo of Understanding, we’ve seen Brent crude drop from about $120 to nearly $70 per barrel in the period of a few months.
For companies with significant supply chain exposure to the Gulf, such as chemical manufacturers, plastics processors, fertilizer producers, steel fabricators, the immediate priority is supply security and alternate sourcing. Asian buyers are already pivoting to U.S. MEG (Monoethylene Glycol) and iron ore suppliers, creating short-term demand uplift for U.S. industrial producers willing to move quickly. This is a six- to twelve-month window for U.S. industrial companies to establish new customer relationships that may persist well beyond the resolution of the conflict.
For business to business, consumer-facing companies on the lower arm of the K, the energy shock is a demand destroyer. When moderate to lower income households face $4.50 gasoline and rising utility bills, discretionary spending is the first to compress. Restaurants, entertainment venues, big-ticket home goods, and apparel in the moderate price tier all face meaningful volume headwinds. Companies that have a strong value proposition and a cost structure built for volume can weather this period; those that were already managing thin margins against a cost-pressured customer base are in a genuinely difficult position.
Signal 4. The Upper Arm of the K is a Big Market with Its Own Fractures.
Tier 1. The upper arm of the K is growing and lucrative but it is not monolithic. At the very top, ultra-high-net-worth households are expanding spending on experiences, fine jewelry, bespoke travel, and wealth management services. BNP Paribas projects 6% organic sales growth for luxury in 2026. The U.S. luxury market is projected to grow from $115 billion in 2024 to nearly $200 billion by 2033. High-end hotel brands like Hilton and Four Seasons continue to outperform their budget and midscale counterparts, sometimes dramatically.
Next Tiers. Below the ultra-wealthy tier, there are fractures. The “aspirational luxury” buyer, for example a shopper saving for a $3,000 handbag or stretching to fly premium economy, has largely retreated. CNBC reported that “the aspirational luxury buyer has virtually disappeared.” Soft luxury categories like leather goods and apparel are softening. The luxury resale market is growing 13.7% annually as aspirational consumers seek brand experience at lower price points. J.P. Morgan found that 60% of consumers across the U.S. and Europe now use resale platforms for luxury goods purchases. And the Hormuz-driven energy shock is introducing new uncertainty even at the top as some luxury companies show cracks with equity market volatility and consumer confidence levels that follow.
The tiers within the tiny upper arm itself, between the truly wealthy and the aspirationally wealthy, are an important distinction. A company positioned for premium or luxury consumers may find that its market is narrowing if it is actually serving the aspirational segment that is conserving, rather than the ultra-wealthy segment that continues to grow and spend.
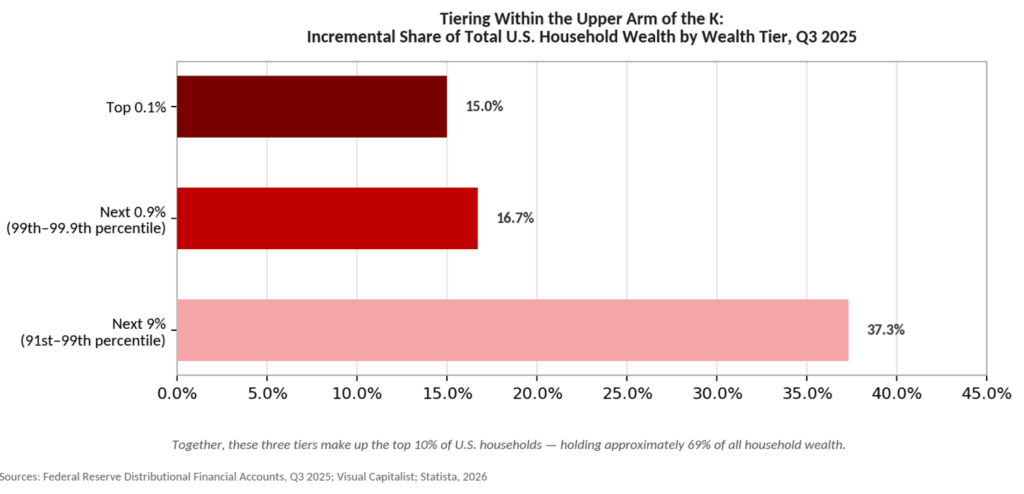
As of Q3 2025, the top 10% of U.S. households hold roughly 69% of all household wealth, split unevenly even among themselves:
- The top 0.1%, representing households with at least approximately $62 million in net worth, control nearly 15% of all wealth in the country. From a household earnings standpoint, the entry point of the 0.1% of earners is approximately $2M per year with the sky as the limit.
- The top 1% (including the 0.1% tier above), representing households with a minimum of approximately $10M in net worth, holds about 17% of all wealth. From a household earnings standpoint, the top 1% of earners make approximately $670,000 per year.
- And to round out the top 10%, the next 9%, representing households with a minimum of approximately $2M in net worth, holds about 37%. From a household earnings standpoint, the threshold of the top 10% of earners is approximately $200,000 of income per year.1
So, in the top of the K, which we often group together, there are multiple strata from the ultra-high-net-worth 0.1% to their country cousins in the next 9.9%. There is a wide spectrum of needs, behaviors, and interests from households with $2M in net worth to households with $62M in net worth. It’s important for businesses that serve the upper K to understand the nuances of each segment relative to their offers.
What Does This Mean for Profitable Revenue Growth?
For companies selling to the premium and luxury market, the priority is clear segmentation and value proposition. Know exactly which tier of the upper arm your customers occupy and understand their needs. Ultra-high-net-worth households are insulated. Aspirational consumers are wary but ready. Products and services built for the next 9.9% need to either migrate up, through genuine differentiation, scarcity, and brand investment, or accept that they are competing in a sensitive segment. The luxury resale boom is an interesting data point. Customers still want brand prestige without the heavy entry-level price, and they are finding ways to access it.
For financial services firms, wealth management platforms, and professional service providers, the concentration of wealth at the top creates a clear strategic mandate, which is to move upstream. The UHNWI population is growing, their assets are growing faster than their spending, and their planning needs such as estate, tax, philanthropic, and cross-border opportunities are specialized. Firms that can build trusted relationships at this level are entering a market that compounds for decades.
For technology, media, and SaaS companies, the upper arm of the K is where willingness to pay for productivity, convenience, and experience remains robust. Enterprise software, AI-powered professional tools, premium subscription services, and high-quality health and wellness platforms all benefit from an affluent customer base that has the budget and the motivation to pay for genuine value. The risk is over-reliance on equity market wealth effects as demand can shift with the market tide.
Signal 5. The K is Different by Global Region.
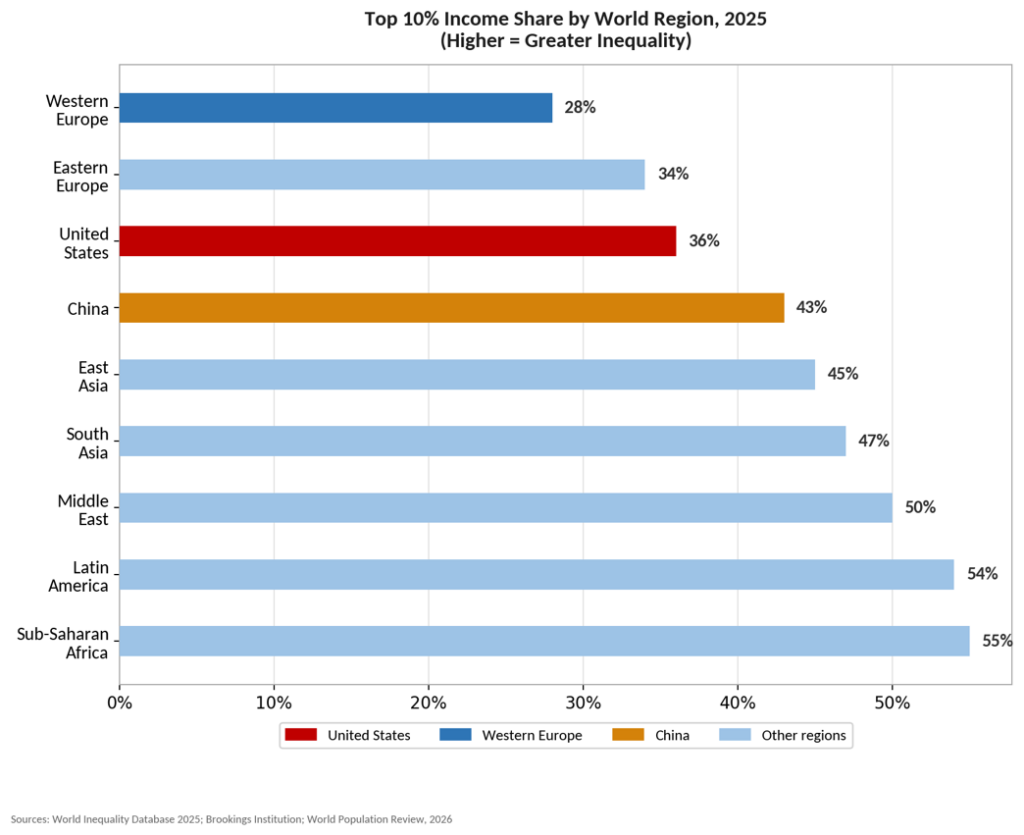
A More Balanced K in Europe. The K-shaped economy is not uniquely American, but the shape of the K varies significantly by region. The United States sits at a 60-year peak in income inequality. The top 10% of earners in the U.S. capture 36% of total income, compared to 28% in Western Europe. Europe’s heavier labor market protections, social safety nets, and universal healthcare shift more to the lower arm of the K.
A More Extreme K in LA and Africa. In Latin America and Sub-Saharan Africa, the bottom of the K is even larger than the U.S. The top 10% in Latin America capture 54% of income. In Sub-Saharan Africa, 55%. With limited tax revenue, high debt burdens, and weak social infrastructure, the Hormuz shock and food price inflation hit populations that are already spending the vast majority of income on necessities. The United Nations Conference on Trade and Development warned that 3.4 billion people live in countries already spending more on debt service than on health or education.
A Mixed K in Asia. China’s luxury market contracted in 2024 and 2025, weighed down by high youth unemployment and a cooling property market, though early 2026 shows signs of stabilization. Southeast Asian economies, including Malaysia, Vietnam, and India, are growing rapidly but face the Hormuz energy shock acutely, since they depend heavily on Gulf crude. India is positioned as a long-term growth story, but in the near term, food and energy inflation is squeezing moderate to lower income populations. Japan and South Korea are more insulated, with mature energy diversification strategies. The World Bank projected that more than a quarter of emerging market and developing economies still have per capita incomes below pre-pandemic levels.
What Does This Mean for Profitable Revenue Growth?
For companies with global operations, the regional variation in the K creates market-by-market opportunities. A GTM strategy that works in the U.S. and Western Europe, with more similar Ks and more affluent populations, may fall flat in Southeast Asia, where the middle class is large and aspirational but financially stretched. A value-focused strategy appropriate for Latin American consumers may be the wrong read for Japan, where quality and service reliability often outweigh price.
The Hormuz disruption has created an urgent near-term consideration for any company with Asian supply chain or customer exposure. Fuel shortages, energy rationing, and shipping disruptions are creating real operational challenges in Vietnam, Bangladesh, Pakistan, and Indonesia. Companies that source from these countries or sell into them need to be actively stress-testing their logistics and inventory assumptions for a sustained disruption scenario.
For U.S. based companies looking at international growth, the European K offers a more stable lower-arm environment. Europe’s social insurance systems mean that mass-market consumer spending is more resilient in downturns as the bottom does not fall as far. The energy crisis from Hormuz is impacting Europe, but the structural supports are stronger than countries in other regions. Companies that can serve European consumers with strong value propositions will find a market that compresses but does not collapse the way a comparably sized U.S. moderate to lower-income market or developing regions might.
Ten Questions for Your Growth Strategy in the K-Shaped Economy.
To set your direction, here are ten questions you may ask your organization:
- Which arm of the K do your most important customer segments (or if you’re a B2B organization, the most important segments of your customer’s customers) occupy? Have you mapped your revenue exposure across income tiers and modeled what happens if the lower arm weakens further?
- How have your core customers changed their buying behavior in the past 18 months? Are they trading down, trading out, or consolidating spending with fewer vendors?
- Where are the winners on the upper arm of the K and are you positioned to serve them? Wealth management, luxury services, premium health and wellness, and high-end B2B are growing, not shrinking.
- Does your pricing architecture reflect the K or are you stuck in the middle?
- How exposed is your supply chain to energy costs?
- Are your customer acquisition and retention economics still valid in a K-shaped environment and what channels, offers, and relationships work on the upper arm may not work on the lower?
- What is your go-to-market strategy for the value-seeking segment?
- How are you tracking and planning for the international K? Which markets are under pressure and which represent opportunity?
- How is the K shaping your talent market? In sectors where your workforce overlaps with cost-pressured consumer households, are wage expectations, retention, and productivity being affected by financial stress?
- What is your three-year scenario if the K widens further (from continued inflation, ongoing geopolitical instability, and AI-driven productivity gains)?
Your Call to Action
The K-shaped economy is disproportional and your organization should have a strategy for the top, the bottom, and the tiers within them. From a global perspective, your strategy should consider variations across the U.S., Europe, Latin America, Asia, and Africa. And if you’re company is business to business focused, you must understand the impact on your business customers’ end consumers.
Consider these Signals from two perspectives: How will they affect your customers and their ability to grow? And how will they affect your own business, your customer and client base, your product mix, your distribution model, and your competitive positioning?
Get beyond current state and ask your team where they see the signals projecting ahead and what this means for your organization’s profitable growth. Consider each of the questions I’ve asked, add your own, create a plan, and get into action.
We would enjoy a conversation about what this means for your business and your growth strategy. Reach out at info@salesglobe.com or visit us at SalesGlobe.com.
______________________________________________________________________________
SalesGlobe is a revenue growth consulting and services firm focused on helping our clients reach their growth aspirations through better solution development and operationalizing to get results in sales strategy, go-to-market, account strategy, and sales compensation.

Founder and Managing Partner at SalesGlobe
“We help companies solve tough sales challenges to connect their sales strategies to the bottom line.”

